AI Copilot for biomedical data that was lacking transparency
Owkin’s product K helps scientists explore biomedical data and literature through an AI copilot.
However, K’s visual outputs, the plots generated by AI, were perceived as black boxes. Uses couldn’t see the data inputs or plot parameters used, nor adjust them without regenerating the entire answer.
This lack of transparency caused frustration, excessive token use, and limited trust in the results
Lack of transparency and control in K’s AI-generated visualizations
Lack of visibility on datasets and filters behind plots
Limited flexibility since any change required full regeneration
Cognitive overload as conversations became long and cluttered
Designing transparent and flexible controls for AI-generated visualizations
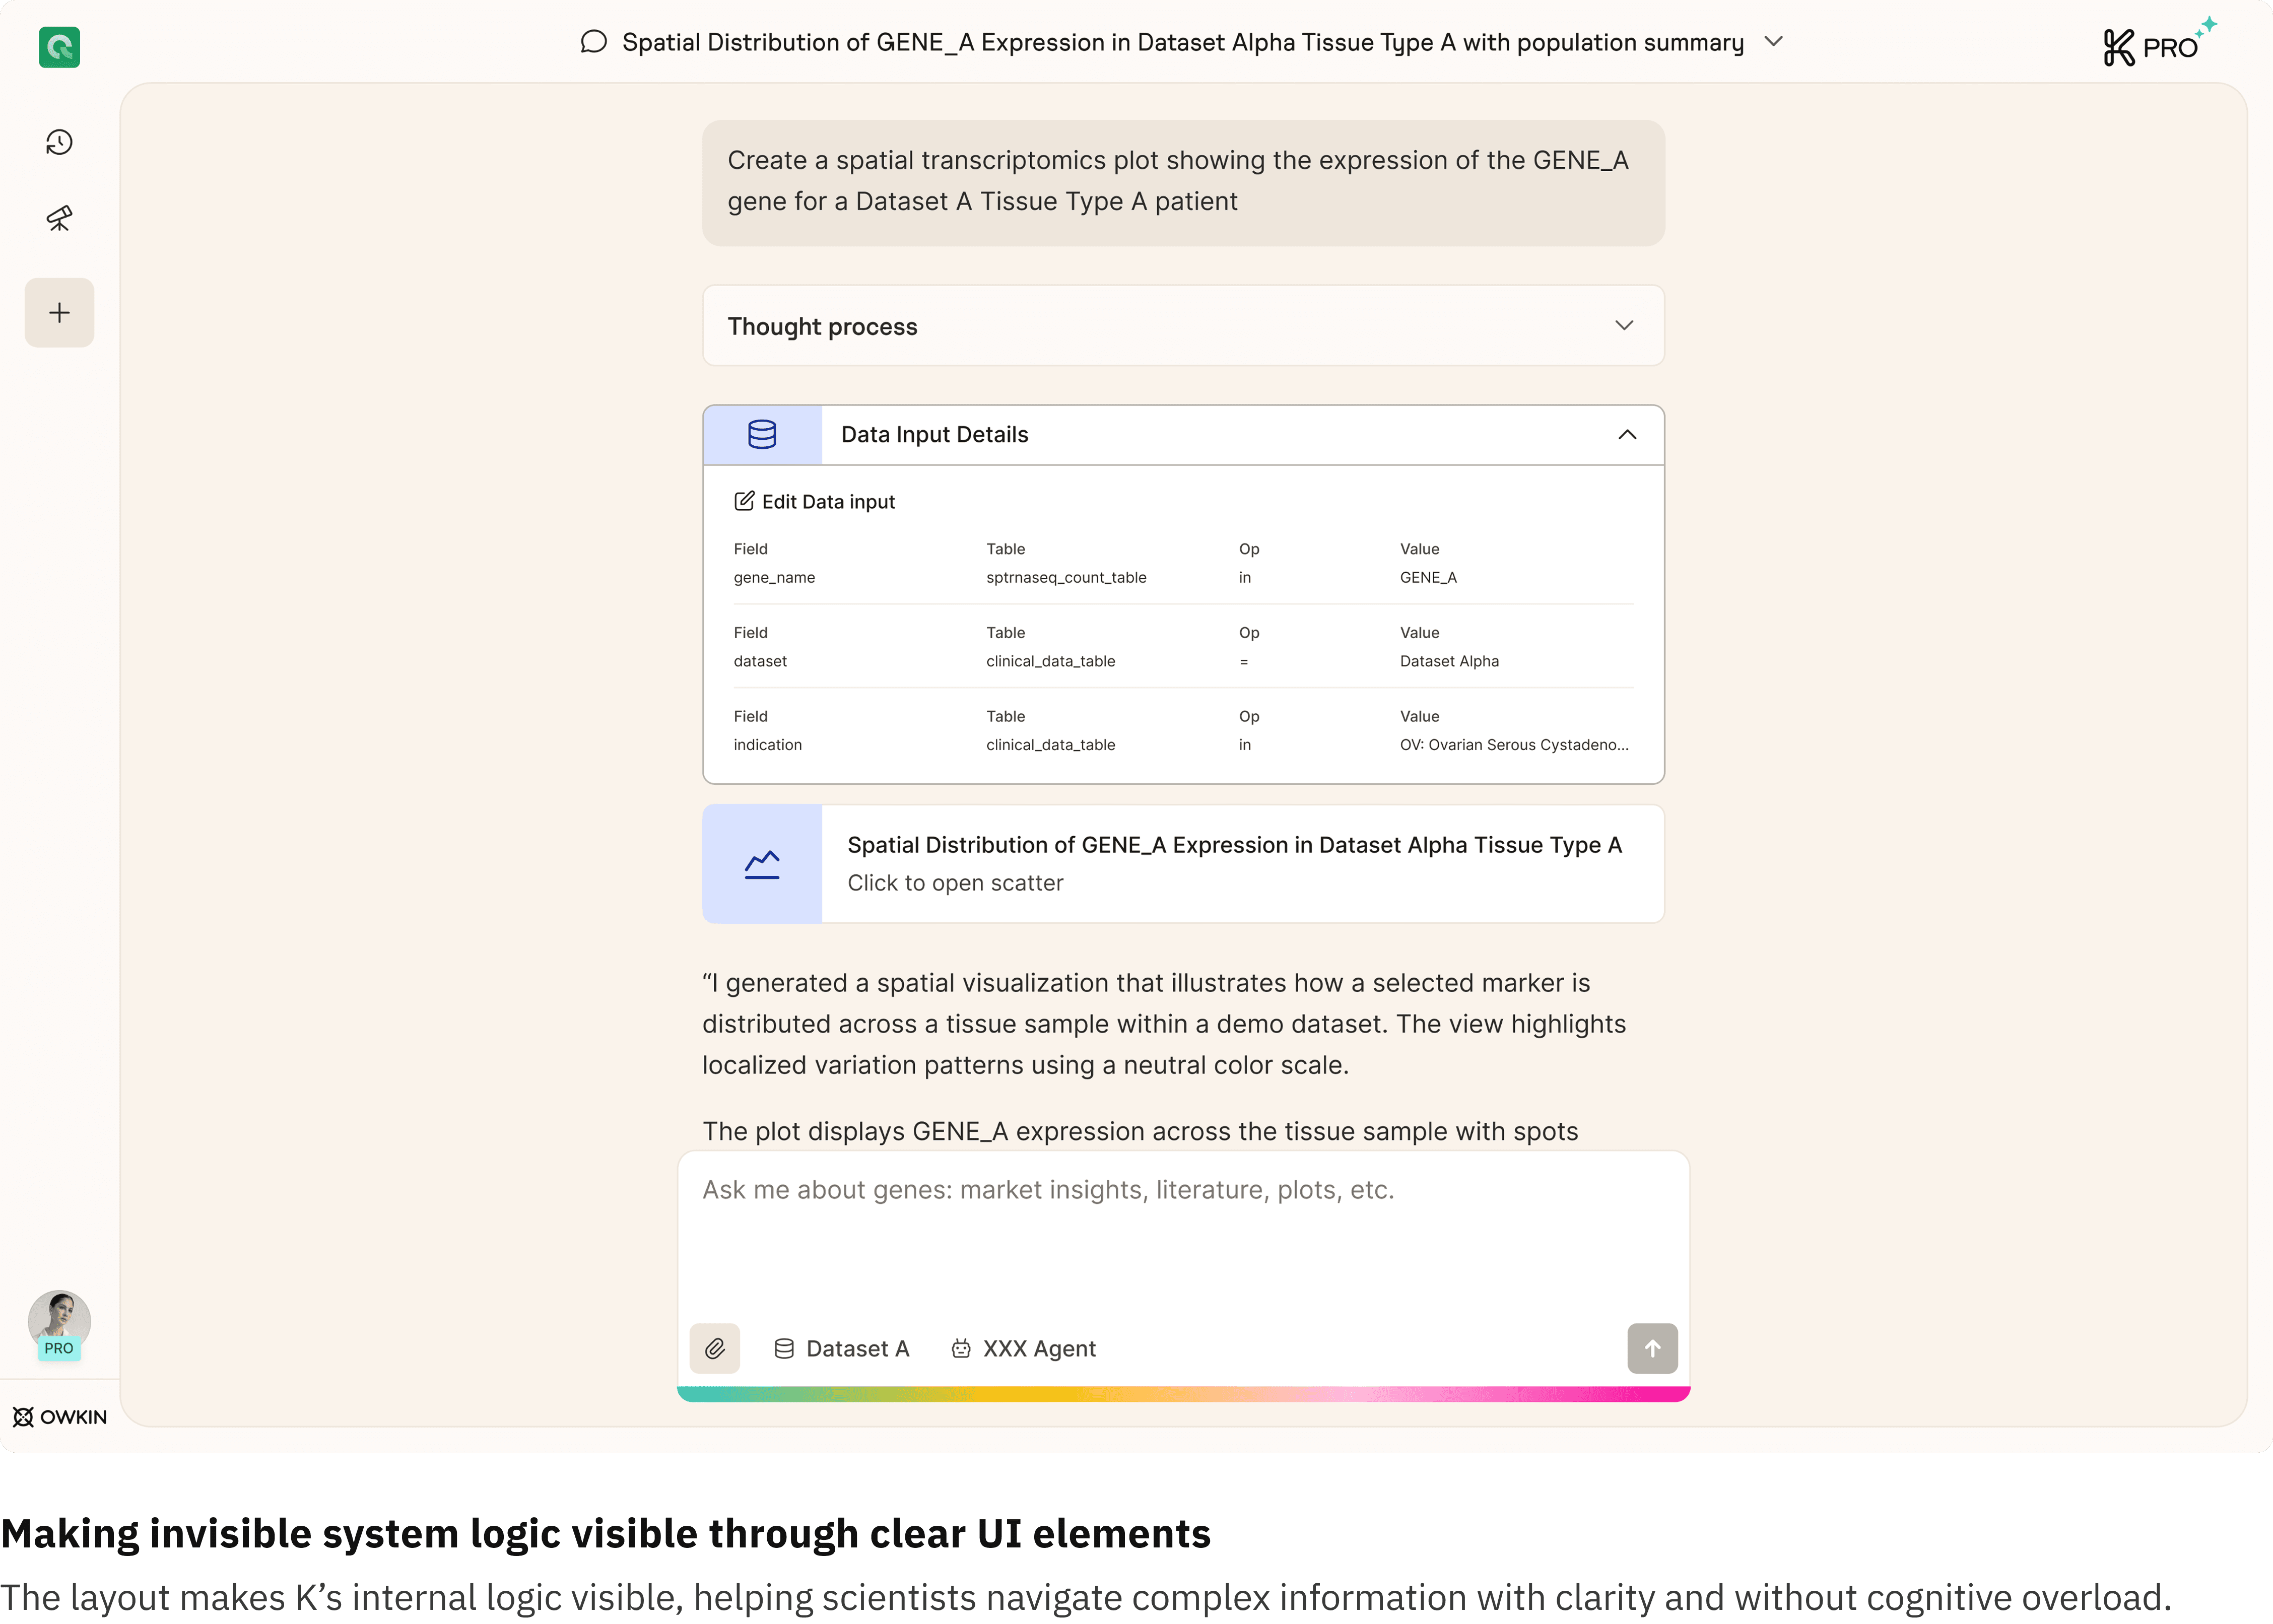
The new design introduced a clear hierarchy between Data Inputs and Plot Settings, enabling scientists to inspect, edit, and reproduce visualizations.
01. Prioritizing data inputs for clarity and trust
Users can now see and edit the datasets and filters used by K, directly from a dedicated Data Input tab, with contextual guidance explaining the impact of edits.
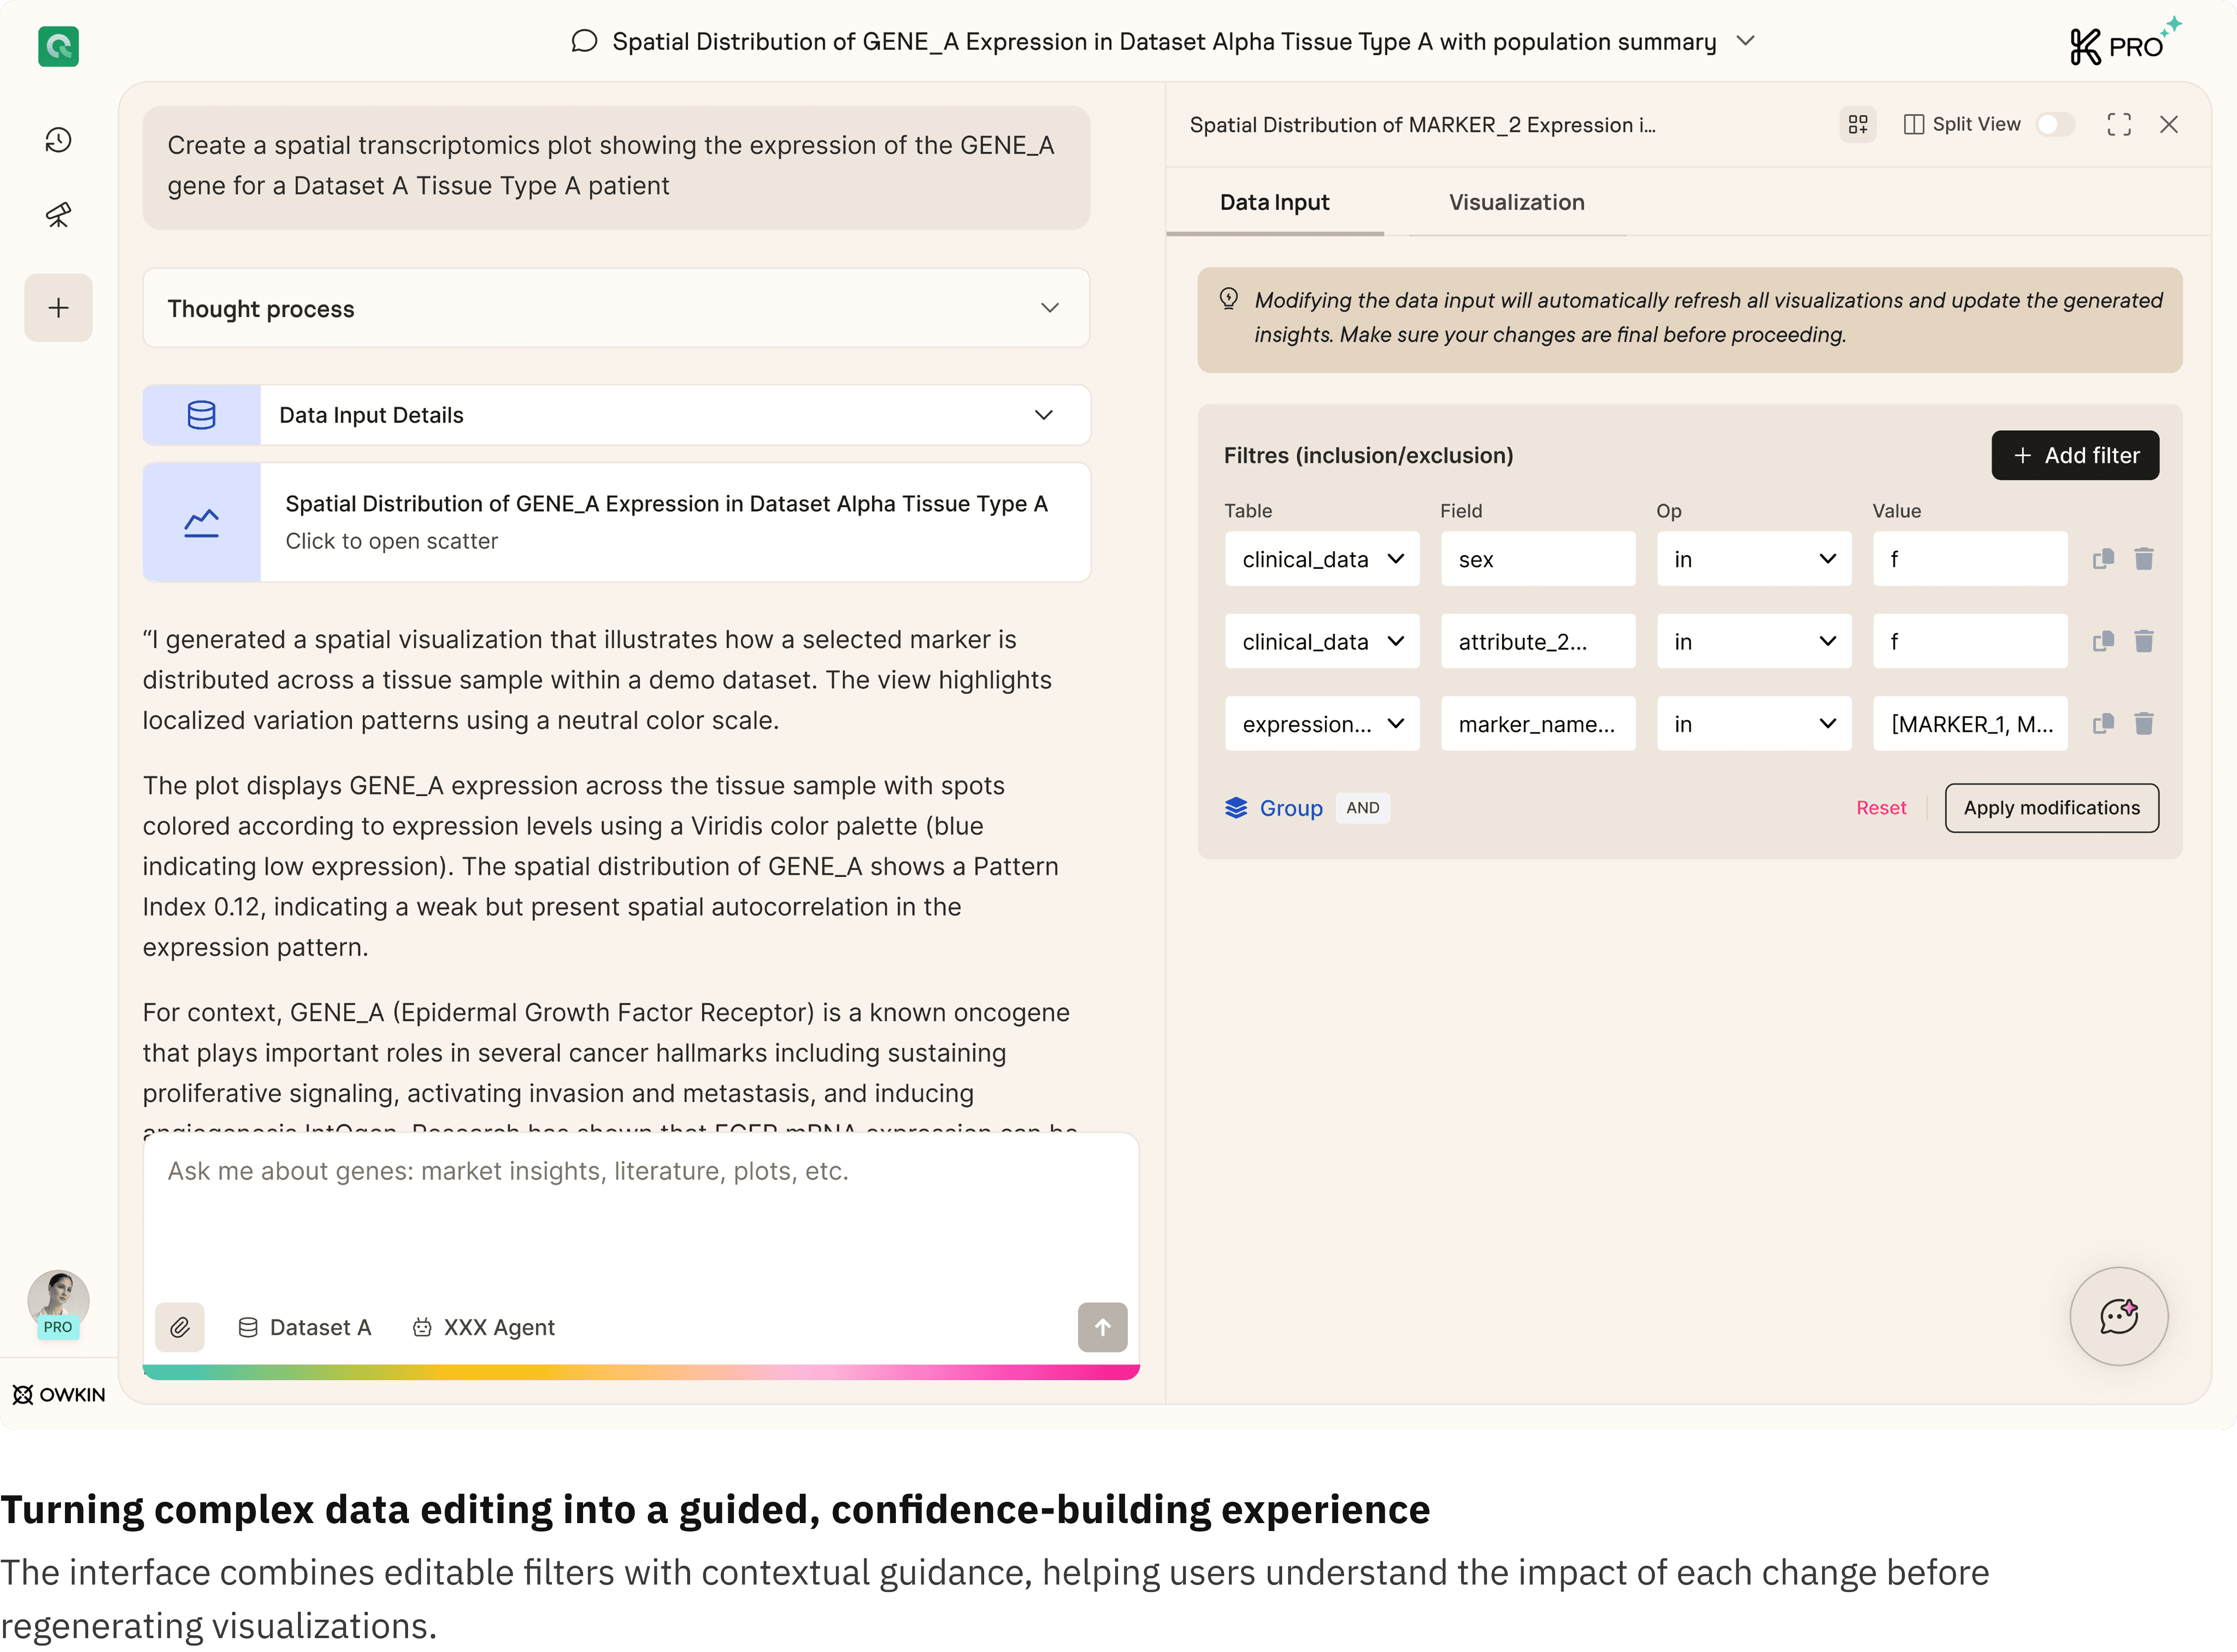
02. Editable data input view
Users can visualize or modify data sources before regeneration. The layout clarifies the causal flow: Data Inputs → Visualizations.
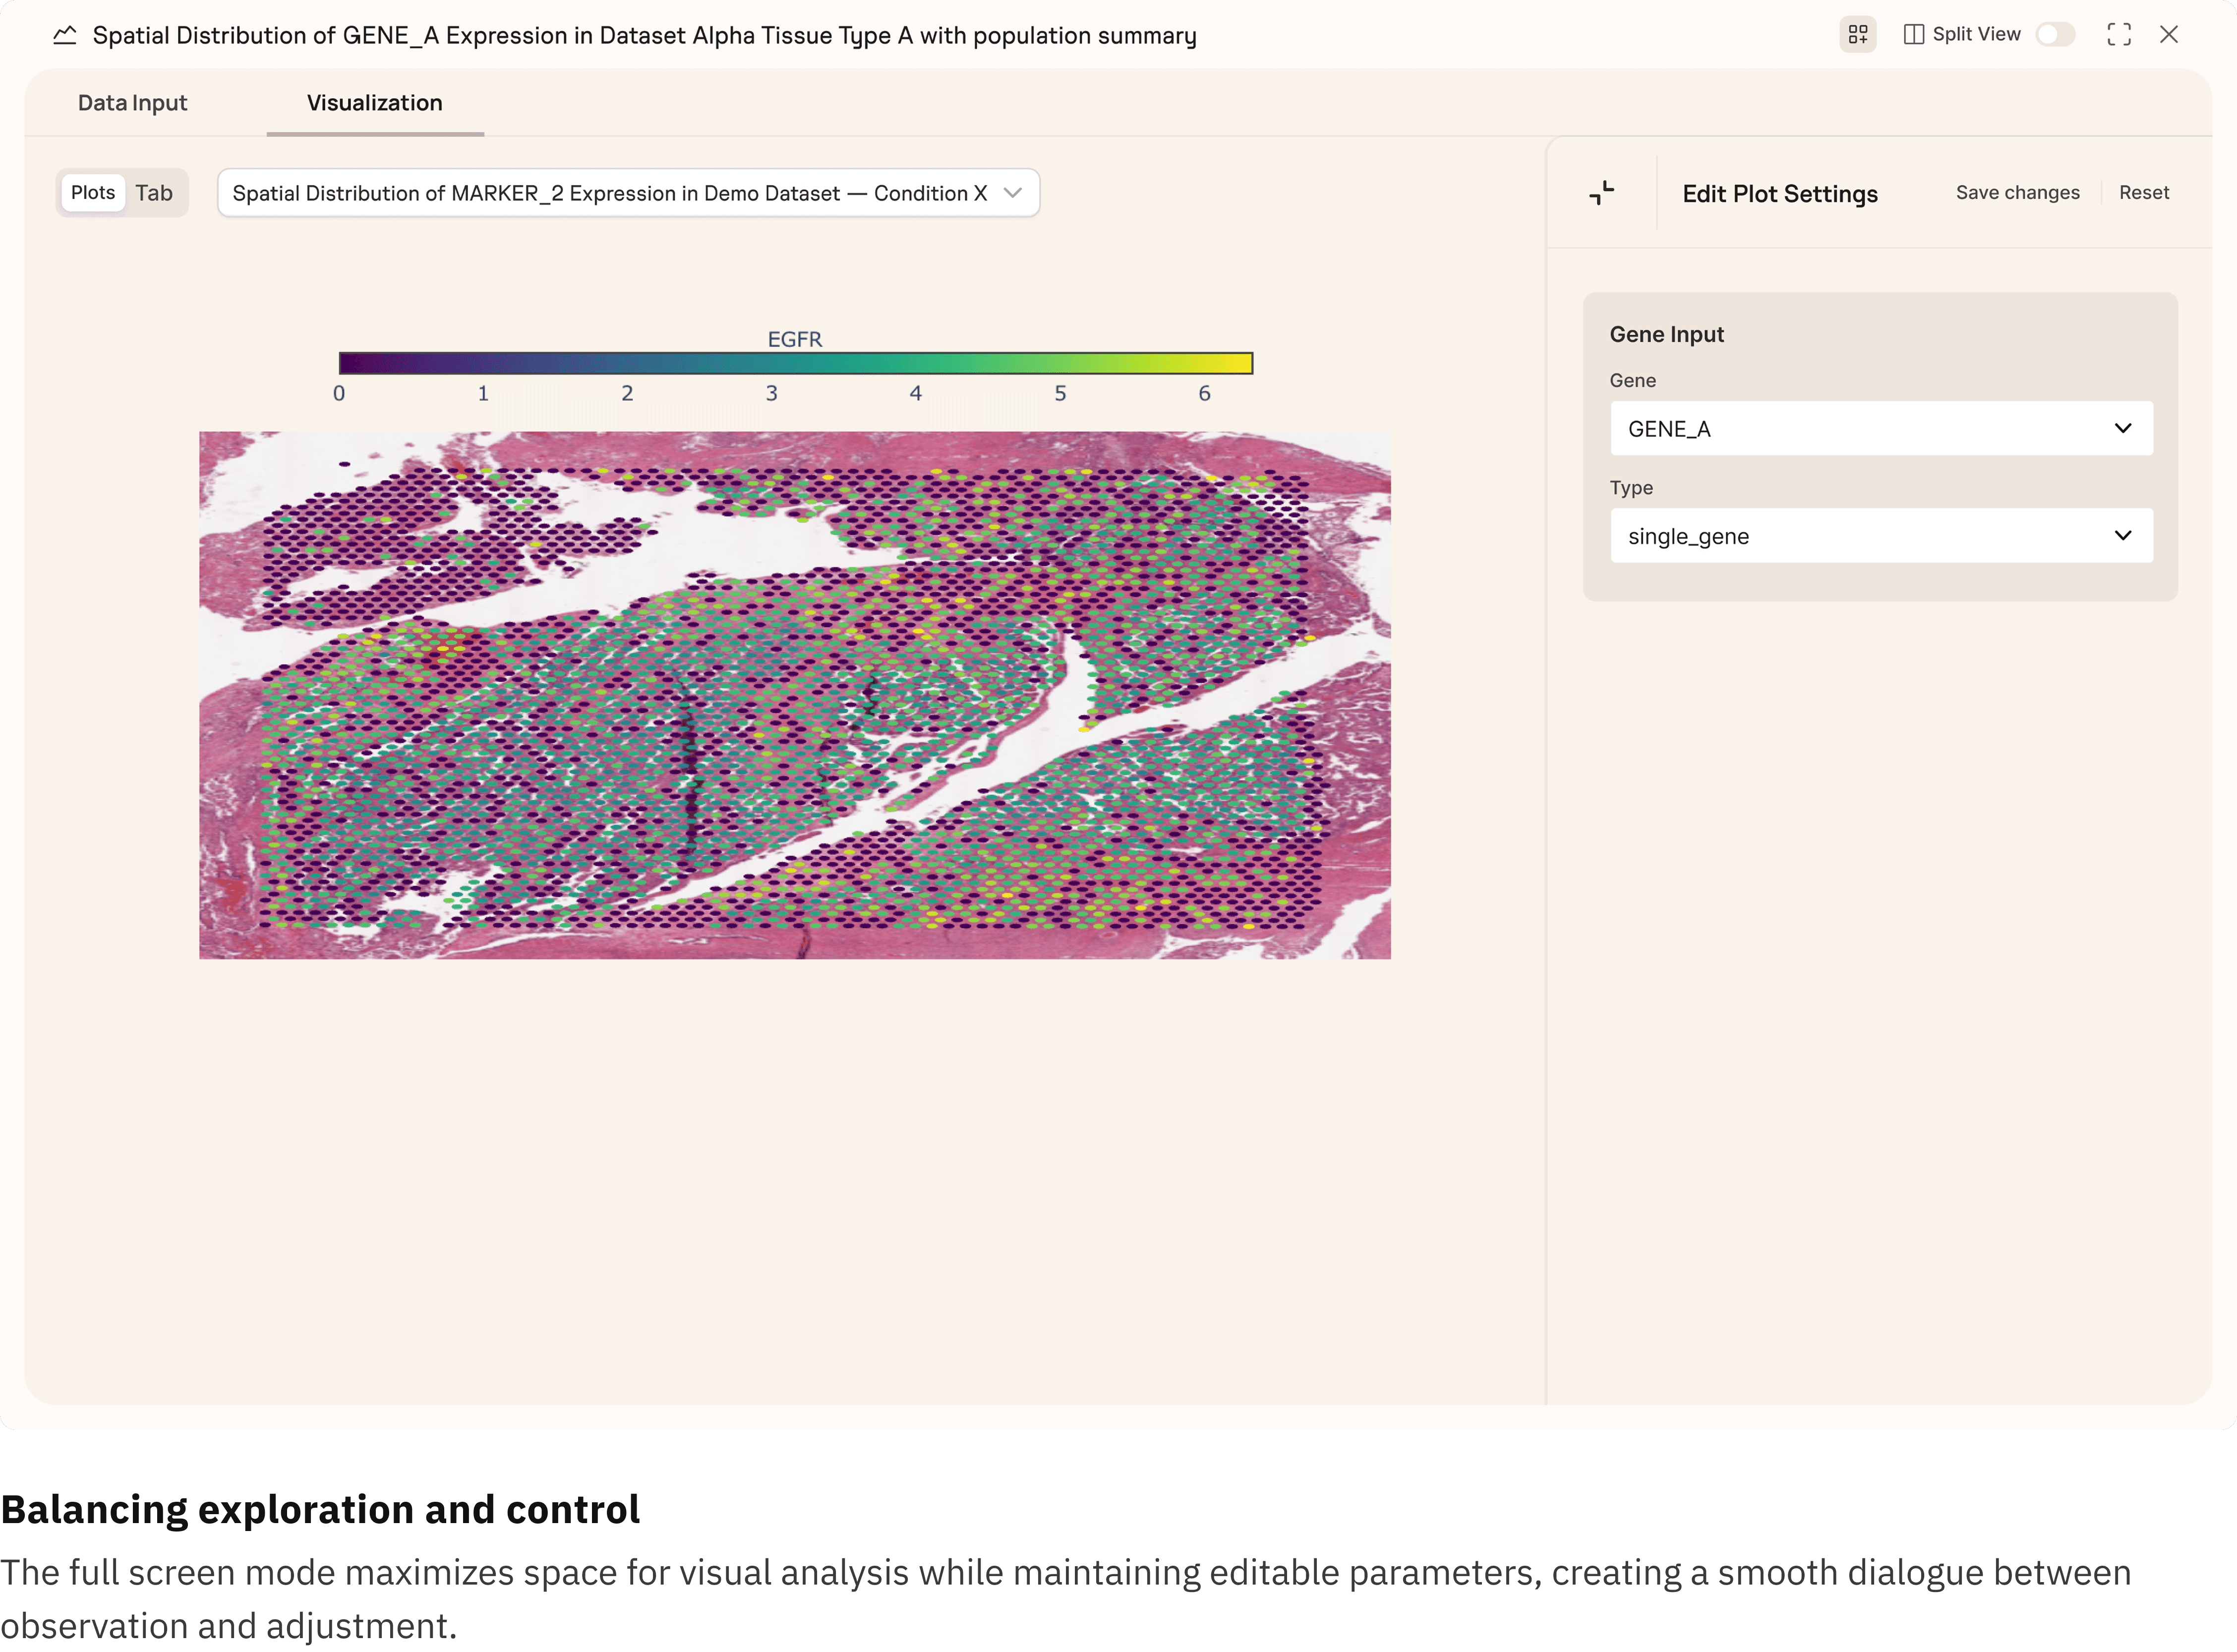
03. Direct control on plot settings
Users can open the Plot Settings panel to refine parameters (for example selected genes or plot type) without regenerating the whole response.
A full-screen mode maximizes visual focus while keeping settings accessible.
A Collaborative, Iterative Design Process
I started by consolidating signals from PostHog surveys and ongoing discussions with Owkin’s Medical team, which quickly revealed a core issue around the lack of interpretability in plots. This led to a series of collaborative work sessions with medical users to unpack the root causes, challenge assumptions, and refine the problem statement.
In parallel, I explored benchmarks and produced rapid wireframes to materialize directions early. These concepts were iterated openly with Medical and Tech teams, ensuring that feasibility, scientific accuracy, and user expectations stayed aligned throughout.
This close collaboration made it possible to converge quickly toward a simple and scalable model separating Data Inputs from Plot Settings. Once validated, I designed the high fidelity screens and interaction flows, integrating technical constraints identified with engineers during the feasibility workshops.
Outcomes
The redesign transformed AI-generated plots from opaque visuals into traceable and controllable scientific artifacts. By revealing the underlying data inputs and plot parameters, scientists could finally understand, verify, and refine K’s outputs without regeneration.
This shift not only reduced token usage and analysis time but also strengthened researchers’ confidence in AI-driven insights, positioning K as a more reliable partner in biomedical discovery.